Prediction of Soil Erodibility in a Neotropical Biome - Latest Research from Dr. Ozeas Costa
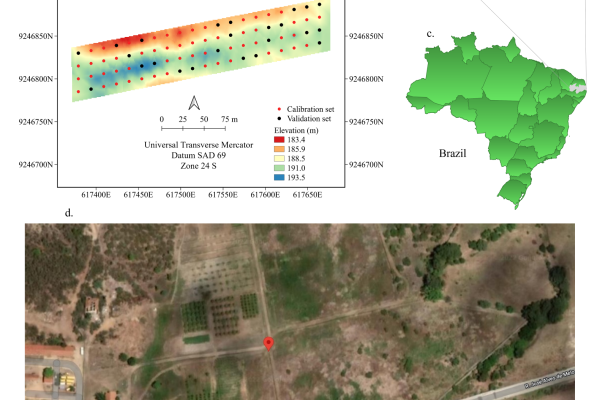
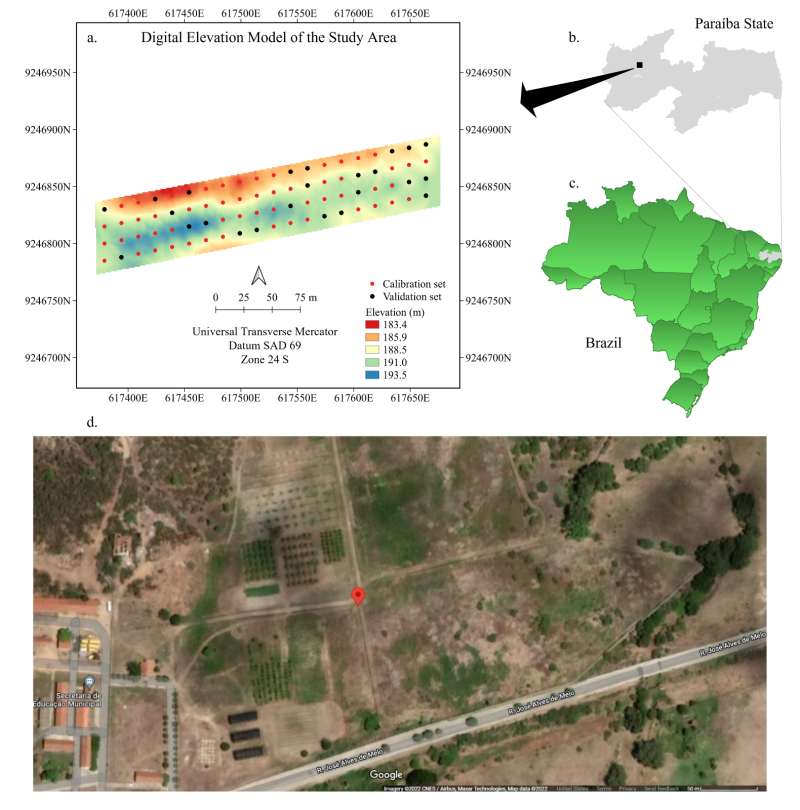
The latest research from Dr. Ozeas Costa – an associate professor in the School of Earth Sciences based at the Mansfield Campus – and his Brazilian collaborators was published in December 2022 in the journal Land (https://doi.org/10.3390/land11122188). This work investigated the variability of soil-erodibility factors under different soil-texture classes in a section of the Brazilian dry forest biome (the Caatinga) recently converted to a mixed agriculture-pasture land use. The Caatinga is a xeric shrubland and thorn forest, which consists primarily of small, thorny trees that seasonally shed their leaves. Cacti, thick-stemmed plants, thorny brush, and arid-adapted grasses make up the ground layer. Many annual plants grow, flower, and die during the brief rainy season, when about 60% of the rainfall occurs in a single month, and up to 20% occurs in a single day of the year. Average annual temperatures are high (around 28 °C) and relative humidity is usually below 50%. This biome, unique to Brazil, covers an area of 912,529 km2, accounting for 10.7% of the Brazilian territory. The Caatinga is considered the largest seasonally dry tropical forest in the neotropics, and has been recognized as the most species-rich neotropical dry forest biome, supporting 950 genera, 3150 species, and 152 families of flowering plants, one-third of which are endemic. Within this complex and diverse region lives a population of more than 20 million people, making it one of the most densely populated semiarid regions in the world: 26 inhabitants per km2. Previous studies have estimated that the annual soil loss in the Caatinga ranges from 3 to 50 tons ha−1 and there is also evidence of several hotspots of advanced desertification.
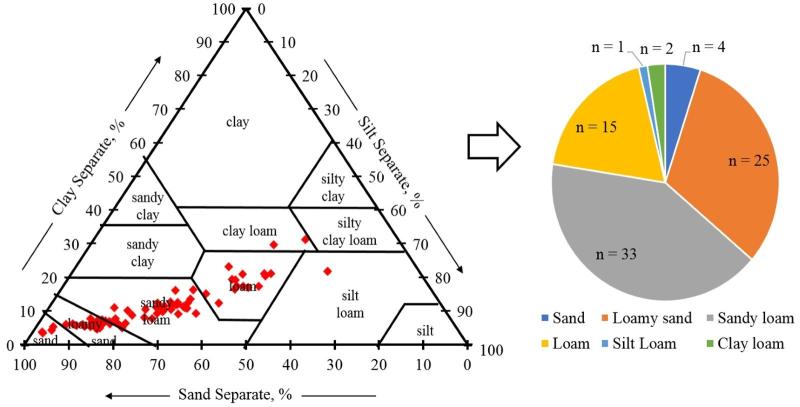
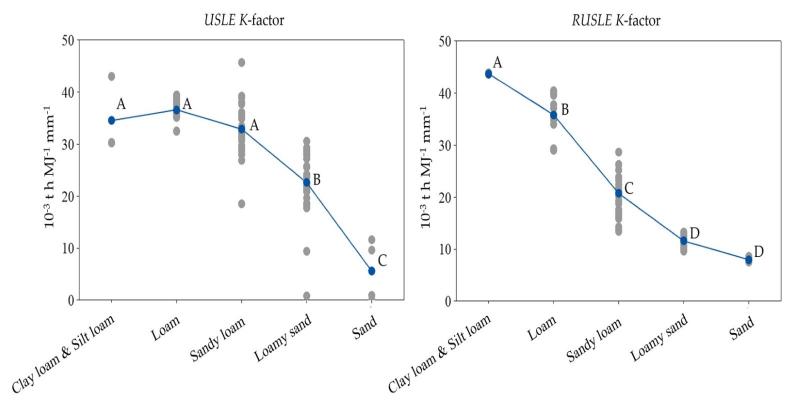
The soil type in the study area varies from loamy to sandy soils, with clay content ranging from 3% to 31%, silt content from 2% to 57%, and sand content from 21% to 92%. Most samples (41%) are classified as sandy loam; another 31% of samples are classified as loamy sand; and another 19% are classified as loam (figure 2). The soil-formation processes active in the Caatinga, in particular the low availability of water to hydrolyze primary minerals from parent materials into clay minerals, result in the dominance of the sand fraction, which, in our study area, represents about 65% of the soil content. The mean concentration of the granulometric fractions decreased in the following order: sand > silt > clay, with the sand texture class showing the widest range of concentrations throughout the study area: 206 to 942 g kg−1. Very fine sand (VFS), the sand fraction with the highest mean concentration (240.28 g kg−1), also presented the smallest variability (SD = 62.79 g kg−1). Conversely, the sand fraction with the highest texture variability within the study area is the fine sand (FS) class (mean = 236.10 g kg−1; SD = 102.90 g kg−1). The high concentration of fine and very fine sand in our study sites suggests that these soils are susceptible to significantly high levels of detachment and transport, as indicated in the resultant soil erodibility calculations (figure 3).
Soil organic matter (SOM) was low and did not exceed 0.2%. Typical undisturbed Caatinga soils have SOM content varying from 0.23% to 1.53%. Our results show that SOM concentrations in the study area are near the minimum value recorded in the literature for arid regions. This may be explained by the soil management in the area (low-intensity polyculture and pasture), combined with the coarse soil texture and the dry, arid climate conditions. The ongoing passion fruit cultivation in the study area likely does not provide enough organic material to increase SOM or to replace the OM lost by the removal of native vegetation. In addition, the dominant coarse texture in the study area (sandy loam and coarser) has been negatively correlated with whole soil organic content, since the predominance of sand fraction in the soil leads to significant oxidation of SOM, which is potentialized in warmer climates.
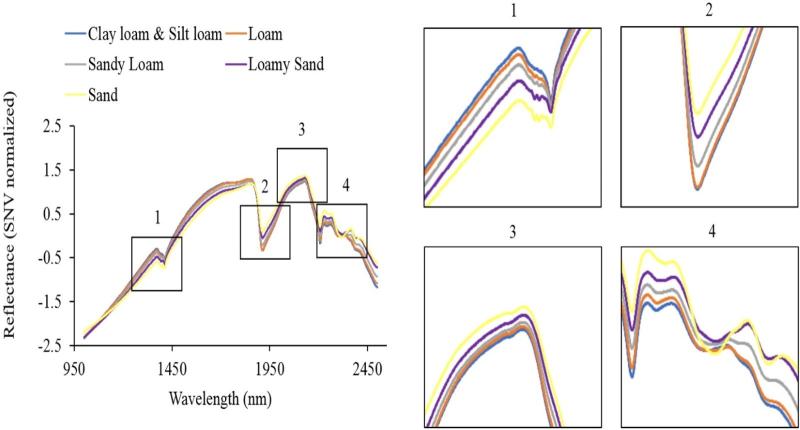
The spectral analysis also shows that particle size distribution is a major influence on the average reflectance spectra of the investigated soils. Our results revealed the presence of representative peaks in the wavelength near to 1350 and 2125 nm, as well as representative valleys in the wavelength near to 1400, 1900, and 2200 nm. In addition, each soil-texture class presents a distinct pattern of spectral signatures in different wavelengths. For instance, the peak/valley combination observed at 1350 nm and 1400 nm (inset 1, figure 4) shows the reflectance decreasing in the following order: clay loam + silt loam > loam > sandy loam > loamy sand > sand. Conversely, for the valleys observed at 1900 nm (inset 2) and at 2200 nm (inset 4), as well as the peak observed at 2125 nm (inset 3), the reflectance decreases in the following order: sand > loamy sand > sandy loam > loam > clay loam + silt loam. The spectral behavior at 1400 and 1900 nm may be associated with 2:1 phyllosilicates, while the features at 1400 and 2200 nm may be associated with lattice OH. In addition, the reflectance peaks around 2200 nm may also be due to the cation OH bonds in phyllosilicate minerals, SiOH bonds, and organic molecules (e.g., CH2, CH3, and NH3). These 2:1 phyllosilicates are mostly expansive clays, which usually do not provide for well-structured soils (because of their swelling–shrinkage behavior) resulting in high susceptibility to erosion.